A wonderful surprise arrived in my gmail inbox this morning. A message from Neil Thomason, a dear colleague of mine, who sends me interesting things to read from time to time. It’s not that much of the time the things Neil sends me aren’t that interesting. It’s just that the interesting things he does send me only come from time to time.
Last time he sent me something, it was this Many Labs paper on replications available at the Open Science Forum. Clearly, Neil was impressed. Ten of 13 classic effects were well replicated, one was so-so, and two were not replicated. Neil must have thought I was having a bad day when I clearly was not sharing in the joy. The main reason for that has to do with the fact that effects and explanations of effects are seldom properly decoupled. As a result, a replication of a classic effect is often communicated as a replication of the explanation of the effect. But of course an effect can be highly replicable yet explained in an entirely improper manner. I believe that the authors of the Many Labs paper fell into that trap of not adequately separating the effects they replicated from the standard interpretations given to them. I went on in my reply at some length about the inherent dangers of doing so (and I should blog about this in a separate post at some point in the future).
I confess that I was disappointed not to get a reply from Neil since I thought my comments posed a thoughtful reply to his exuberant reaction. I thought those comments would spark a lively discussion of the issue, perhaps leading us toward some sound principles to guide similar future endeavours. Neil is after all a philosopher of science.
At any rate, nearly 3 months later, this morning, I got a message from him. Just this link to a blog post by Matthew Hankins entitled “Still Not Significant.” I really enjoyed the post, which deals with the many creative ways researchers find to describe their results when their statistical significance values are at or greater than the magical p < 0.05 level. I encourage you to read the post, but just in case you’re too busy or lazy to do so, I’ve reproduced the list of circumlocutory expressions quoted there. I warn you, the list is long, but also entertaining:
(barely) not statistically significant (p=0.052)
a barely detectable statistically significant difference (p=0.073)
a borderline significant trend (p=0.09)
a certain trend toward significance (p=0.08)
a clear tendency to significance (p=0.052)
a clear trend (p<0.09)
a clear, strong trend (p=0.09)
a considerable trend toward significance (p=0.069)
a decreasing trend (p=0.09)
a definite trend (p=0.08)
a distinct trend toward significance (p=0.07)
a favorable trend (p=0.09)
a favourable statistical trend (p=0.09)
a little significant (p<0.1)
a margin at the edge of significance (p=0.0608)
a marginal trend (p=0.09)
a marginal trend toward significance (p=0.052)
a marked trend (p=0.07)
a mild trend (p<0.09)
a moderate trend toward significance (p=0.068)
a near-significant trend (p=0.07)
a negative trend (p=0.09)
a nonsignificant trend (p<0.1)
a nonsignificant trend toward significance (p=0.1)
a notable trend (p<0.1)
a numerical increasing trend (p=0.09)
a numerical trend (p=0.09)
a positive trend (p=0.09)
a possible trend (p=0.09)
a possible trend toward significance (p=0.052)
a pronounced trend (p=0.09)
a reliable trend (p=0.058)
a robust trend toward significance (p=0.0503)
a significant trend (p=0.09)
a slight slide towards significance (p<0.20)
a slight tendency toward significance(p<0.08)
a slight trend (p<0.09)
a slight trend toward significance (p=0.098)
a slightly increasing trend (p=0.09)
a small trend (p=0.09)
a statistical trend (p=0.09)
a statistical trend toward significance (p=0.09)
a strong tendency towards statistical significance (p=0.051)
a strong trend (p=0.077)
a strong trend toward significance (p=0.08)
a substantial trend toward significance (p=0.068)
a suggestive trend (p=0.06)
a trend close to significance (p=0.08)
a trend significance level (p=0.08)
a trend that approached significance (p<0.06)
a very slight trend toward significance (p=0.20)
a weak trend (p=0.09)
a weak trend toward significance (p=0.12)
a worrying trend (p=0.07)
all but significant (p=0.055)
almost achieved significance (p=0-065)
almost approached significance (p=0.065)
almost attained significance (p<0.06)
almost became significant (p=0.06)
almost but not quite significant (p=0.06)
almost clinically significant (p<0.10)
almost insignificant (p>0.065)
almost marginally significant (p>0.05)
almost non-significant (p=0.083)
almost reached statistical significance (p=0.06)
almost significant (p=0.06)
almost significant tendency (p=0.06)
almost statistically significant (p=0.06)
an adverse trend (p=0.10)
an apparent trend (p=0.286)
an associative trend (p=0.09)
an elevated trend (p<0.05)
an encouraging trend (p<0.1)
an established trend (p<0.10)
an evident trend (p=0.13)
an expected trend (p=0.08)
an important trend (p=0.066)
an increasing trend (p<0.09)
an interesting trend (p=0.1)
an inverse trend toward significance (p=0.06)
an observed trend (p=0.06)
an obvious trend (p=0.06)
an overall trend (p=0.2)
an unexpected trend (p=0.09)
an unexplained trend (p=0.09)
an unfavorable trend (p<0.10)
appeared to be marginally significant (p<0.10)
approached acceptable levels of statistical significance (p=0.054)
approached but did not quite achieve significance (p>0.05)
approached but fell short of significance (p=0.07)
approached conventional levels of significance (p<0.10)
approached near significance (p=0.06)
approached our criterion of significance (p>0.08)
approached significant (p=0.11)
approached the borderline of significance (p=0.07)
approached the level of significance (p=0.09)
approached trend levels of significance (p0.05)
approached, but did reach, significance (p=0.065)
approaches but fails to achieve a customary level of statistical significance (p=0.154)
approaches statistical significance (p>0.06)
approaching a level of significance (p=0.089)
approaching an acceptable significance level (p=0.056)
approaching borderline significance (p=0.08)
approaching borderline statistical significance (p=0.07)
approaching but not reaching significance (p=0.53)
approaching clinical significance (p=0.07)
approaching close to significance (p<0.1)
approaching conventional significance levels (p=0.06)
approaching conventional statistical significance (p=0.06)
approaching formal significance (p=0.1052)
approaching independent prognostic significance (p=0.08)
approaching marginal levels of significance p<0.107)
approaching marginal significance (p=0.064)
approaching more closely significance (p=0.06)
approaching our preset significance level (p=0.076)
approaching prognostic significance (p=0.052)
approaching significance (p=0.09)
approaching the traditional significance level (p=0.06)
approaching to statistical significance (p=0.075)
approaching, although not reaching, significance (p=0.08)
approaching, but not reaching, significance (p<0.09)
approximately significant (p=0.053)
approximating significance (p=0.09)
arguably significant (p=0.07)
as good as significant (p=0.0502)
at the brink of significance (p=0.06)
at the cusp of significance (p=0.06)
at the edge of significance (p=0.055)
at the limit of significance (p=0.054)
at the limits of significance (p=0.053)
at the margin of significance (p=0.056)
at the margin of statistical significance (p<0.07)
at the verge of significance (p=0.058)
at the very edge of significance (p=0.053)
barely below the level of significance (p=0.06)
barely escaped statistical significance (p=0.07)
barely escapes being statistically significant at the 5% risk level (0.1>p>0.05)
barely failed to attain statistical significance (p=0.067)
barely fails to attain statistical significance at conventional levels (p<0.10
barely insignificant (p=0.075)
barely missed statistical significance (p=0.051)
barely missed the commonly acceptable significance level (p<0.053)
barely outside the range of significance (p=0.06)
barely significant (p=0.07)
below (but verging on) the statistical significant level (p>0.05)
better trends of improvement (p=0.056)
bordered on a statistically significant value (p=0.06)
bordered on being significant (p>0.07)
bordered on being statistically significant (p=0.0502)
bordered on but was not less than the accepted level of significance (p>0.05)
bordered on significant (p=0.09)
borderline conventional significance (p=0.051)
borderline level of statistical significance (p=0.053)
borderline significant (p=0.09)
borderline significant trends (p=0.099)
close to a marginally significant level (p=0.06)
close to being significant (p=0.06)
close to being statistically significant (p=0.055)
close to borderline significance (p=0.072)
close to the boundary of significance (p=0.06)
close to the level of significance (p=0.07)
close to the limit of significance (p=0.17)
close to the margin of significance (p=0.055)
close to the margin of statistical significance (p=0.075)
closely approaches the brink of significance (p=0.07)
closely approaches the statistical significance (p=0.0669)
closely approximating significance (p>0.05)
closely not significant (p=0.06)
closely significant (p=0.058)
close-to-significant (p=0.09)
did not achieve conventional threshold levels of statistical significance (p=0.08)
did not exceed the conventional level of statistical significance (p<0.08)
did not quite achieve acceptable levels of statistical significance (p=0.054)
did not quite achieve significance (p=0.076)
did not quite achieve the conventional levels of significance (p=0.052)
did not quite achieve the threshold for statistical significance (p=0.08)
did not quite attain conventional levels of significance (p=0.07)
did not quite reach a statistically significant level (p=0.108)
did not quite reach conventional levels of statistical significance (p=0.079)
did not quite reach statistical significance (p=0.063)
did not reach the traditional level of significance (p=0.10)
did not reach the usually accepted level of clinical significance (p=0.07)
difference was apparent (p=0.07)
direction heading towards significance (p=0.10)
does not appear to be sufficiently significant (p>0.05)
does not narrowly reach statistical significance (p=0.06)
does not reach the conventional significance level (p=0.098)
effectively significant (p=0.051)
equivocal significance (p=0.06)
essentially significant (p=0.10)
extremely close to significance (p=0.07)
failed to reach significance on this occasion (p=0.09)
failed to reach statistical significance (p=0.06)
fairly close to significance (p=0.065)
fairly significant (p=0.09)
falls just short of standard levels of statistical significance (p=0.06)
fell (just) short of significance (p=0.08)
fell barely short of significance (p=0.08)
fell just short of significance (p=0.07)
fell just short of statistical significance (p=0.12)
fell just short of the traditional definition of statistical significance (p=0.051)
fell marginally short of significance (p=0.07)
fell narrowly short of significance (p=0.0623)
fell only marginally short of significance (p=0.0879)
fell only short of significance (p=0.06)
fell short of significance (p=0.07)
fell slightly short of significance (p>0.0167)
fell somewhat short of significance (p=0.138)
felt short of significance (p=0.07)
flirting with conventional levels of significance (p>0.1)
heading towards significance (p=0.086)
highly significant (p=0.09)
hint of significance (p>0.05)
hovered around significance (p = 0.061)
hovered at nearly a significant level (p=0.058)
hovering closer to statistical significance (p=0.076)
hovers on the brink of significance (p=0.055)
in the edge of significance (p=0.059)
in the verge of significance (p=0.06)
inconclusively significant (p=0.070)
indeterminate significance (p=0.08)
indicative significance (p=0.08)
is just outside the conventional levels of significance
just about significant (p=0.051)
just above the arbitrary level of significance (p=0.07)
just above the margin of significance (p=0.053)
just at the conventional level of significance (p=0.05001)
just barely below the level of significance (p=0.06)
just barely failed to reach significance (p<0.06)
just barely insignificant (p=0.11)
just barely statistically significant (p=0.054)
just beyond significance (p=0.06)
just borderline significant (p=0.058)
just escaped significance (p=0.07)
just failed significance (p=0.057)
just failed to be significant (p=0.072)
just failed to reach statistical significance (p=0.06)
just failing to reach statistical significance (p=0.06)
just fails to reach conventional levels of statistical significance (p=0.07)
just lacked significance (p=0.053)
just marginally significant (p=0.0562)
just missed being statistically significant (p=0.06)
just missing significance (p=0.07)
just on the verge of significance (p=0.06)
just outside accepted levels of significance (p=0.06)
just outside levels of significance (p<0.08)
just outside the bounds of significance (p=0.06)
just outside the conventional levels of significance (p=0.1076)
just outside the level of significance (p=0.0683)
just outside the limits of significance (p=0.06)
just outside the traditional bounds of significance (p=0.06)
just over the limits of statistical significance (p=0.06)
just short of significance (p=0.07)
just shy of significance (p=0.053)
just skirting the boundary of significance (p=0.052)
just tendentially significant (p=0.056)
just tottering on the brink of significance at the 0.05 level
just very slightly missed the significance level (p=0.086)
leaning towards significance (p=0.15)
leaning towards statistical significance (p=0.06)
likely to be significant (p=0.054)
loosely significant (p=0.10)
marginal significance (p=0.07)
marginally and negatively significant (p=0.08)
marginally insignificant (p=0.08)
marginally nonsignificant (p=0.096)
marginally outside the level of significance
marginally significant (p>=0.1)
marginally significant tendency (p=0.08)
marginally statistically significant (p=0.08)
may not be significant (p=0.06)
medium level of significance (p=0.051)
mildly significant (p=0.07)
missed narrowly statistical significance (p=0.054)
moderately significant (p>0.11)
modestly significant (p=0.09)
narrowly avoided significance (p=0.052)
narrowly eluded statistical significance (p=0.0789)
narrowly escaped significance (p=0.08)
narrowly evaded statistical significance (p>0.05)
narrowly failed significance (p=0.054)
narrowly missed achieving significance (p=0.055)
narrowly missed overall significance (p=0.06)
narrowly missed significance (p=0.051)
narrowly missed standard significance levels (p<0.07)
narrowly missed the significance level (p=0.07)
narrowly missing conventional significance (p=0.054)
near limit significance (p=0.073)
near miss of statistical significance (p>0.1)
near nominal significance (p=0.064)
near significance (p=0.07)
near to statistical significance (p=0.056)
near/possible significance(p=0.0661)
near-borderline significance (p=0.10)
near-certain significance (p=0.07)
nearing significance (p<0.051)
nearly acceptable level of significance (p=0.06)
nearly approaches statistical significance (p=0.079)
nearly borderline significance (p=0.052)
nearly negatively significant (p<0.1)
nearly positively significant (p=0.063)
nearly reached a significant level (p=0.07)
nearly reaching the level of significance (p<0.06)
nearly significant (p=0.06)
nearly significant tendency (p=0.06)
nearly, but not quite significant (p>0.06)
near-marginal significance (p=0.18)
near-significant (p=0.09)
near-to-significance (p=0.093)
near-trend significance (p=0.11)
nominally significant (p=0.08)
non-insignificant result (p=0.500)
non-significant in the statistical sense (p>0.05
not absolutely significant but very probably so (p>0.05)
not as significant (p=0.06)
not clearly significant (p=0.08)
not completely significant (p=0.07)
not completely statistically significant (p=0.0811)
not conventionally significant (p=0.089), but..
not currently significant (p=0.06)
not decisively significant (p=0.106)
not entirely significant (p=0.10)
not especially significant (p>0.05)
not exactly significant (p=0.052)
not extremely significant (p<0.06)
not formally significant (p=0.06)
not fully significant (p=0.085)
not globally significant (p=0.11)
not highly significant (p=0.089)
not insignificant (p=0.056)
not markedly significant (p=0.06)
not moderately significant (P>0.20)
not non-significant (p>0.1)
not numerically significant (p>0.05)
not obviously significant (p>0.3)
not overly significant (p>0.08)
not quite borderline significance (p>=0.089)
not quite reach the level of significance (p=0.07)
not quite significant (p=0.118)
not quite within the conventional bounds of statistical significance (p=0.12)
not reliably significant (p=0.091)
not remarkably significant (p=0.236)
not significant by common standards (p=0.099)
not significant by conventional standards (p=0.10)
not significant by traditional standards (p<0.1)
not significant in the formal statistical sense (p=0.08)
not significant in the narrow sense of the word (p=0.29)
not significant in the normally accepted statistical sense (p=0.064)
not significantly significant but..clinically meaningful (p=0.072)
not statistically quite significant (p<0.06)
not strictly significant (p=0.06)
not strictly speaking significant (p=0.057)
not technically significant (p=0.06)
not that significant (p=0.08)
not to an extent that was fully statistically significant (p=0.06)
not too distant from statistical significance at the 10% level
not too far from significant at the 10% level
not totally significant (p=0.09)
not unequivocally significant (p=0.055)
not very definitely significant (p=0.08)
not very definitely significant from the statistical point of view (p=0.08)
not very far from significance (p<0.092)
not very significant (p=0.1)
not very statistically significant (p=0.10)
not wholly significant (p>0.1)
not yet significant (p=0.09)
not strongly significant (p=0.08)
noticeably significant (p=0.055)
on the border of significance (p=0.063)
on the borderline of significance (p=0.0699)
on the borderlines of significance (p=0.08)
on the boundaries of significance (p=0.056)
on the boundary of significance (p=0.055)
on the brink of significance (p=0.052)
on the cusp of conventional statistical significance (p=0.054)
on the cusp of significance (p=0.058)
on the edge of significance (p>0.08)
on the limit to significant (p=0.06)
on the margin of significance (p=0.051)
on the threshold of significance (p=0.059)
on the verge of significance (p=0.053)
on the very borderline of significance (0.05<p<0.06)
on the very fringes of significance (p=0.099)
on the very limits of significance (0.1>p>0.05)
only a little short of significance (p>0.05)
only just failed to meet statistical significance (p=0.051)
only just insignificant (p>0.10)
only just missed significance at the 5% level
only marginally fails to be significant at the 95% level (p=0.06)
only marginally nearly insignificant (p=0.059)
only marginally significant (p=0.9)
only slightly less than significant (p=0.08)
only slightly missed the conventional threshold of significance (p=0.062)
only slightly missed the level of significance (p=0.058)
only slightly missed the significance level (p=0·0556)
only slightly non-significant (p=0.0738)
only slightly significant (p=0.08)
partial significance (p>0.09)
partially significant (p=0.08)
partly significant (p=0.08)
perceivable statistical significance (p=0.0501)
possible significance (p<0.098)
possibly marginally significant (p=0.116)
possibly significant (0.05<p>0.10)
possibly statistically significant (p=0.10)
potentially significant (p>0.1)
practically significant (p=0.06)
probably not experimentally significant (p=0.2)
probably not significant (p>0.25)
probably not statistically significant (p=0.14)
probably significant (p=0.06)
provisionally significant (p=0.073)
quasi-significant (p=0.09)
questionably significant (p=0.13)
quite close to significance at the 10% level (p=0.104)
quite significant (p=0.07)
rather marginal significance (p>0.10)
reached borderline significance (p=0.0509)
reached near significance (p=0.07)
reasonably significant (p=0.07)
remarkably close to significance (p=0.05009)
resides on the edge of significance (p=0.10)
roughly significant (p>0.1)
scarcely significant (0.05<p>0.1)
significant at the .07 level
significant tendency (p=0.09)
significant to some degree (0<p>1)
significant, or close to significant effects (p=0.08, p=0.05)
significantly better overall (p=0.051)
significantly significant (p=0.065)
similar but not nonsignificant trends (p>0.05)
slight evidence of significance (0.1>p>0.05)
slight non-significance (p=0.06)
slight significance (p=0.128)
slight tendency toward significance (p=0.086)
slightly above the level of significance (p=0.06)
slightly below the level of significance (p=0.068)
slightly exceeded significance level (p=0.06)
slightly failed to reach statistical significance (p=0.061)
slightly insignificant (p=0.07)
slightly less than needed for significance (p=0.08)
slightly marginally significant (p=0.06)
slightly missed being of statistical significance (p=0.08)
slightly missed statistical significance (p=0.059)
slightly missed the conventional level of significance (p=0.061)
slightly missed the level of statistical significance (p<0.10)
slightly missed the margin of significance (p=0.051)
slightly not significant (p=0.06)
slightly outside conventional statistical significance (p=0.051)
slightly outside the margins of significance (p=0.08)
slightly outside the range of significance (p=0.09)
slightly outside the significance level (p=0.077)
slightly outside the statistical significance level (p=0.053)
slightly significant (p=0.09)
somewhat marginally significant (p>0.055)
somewhat short of significance (p=0.07)
somewhat significant (p=0.23)
somewhat statistically significant (p=0.092)
strong trend toward significance (p=0.08)
sufficiently close to significance (p=0.07)
suggestive but not quite significant (p=0.061)
suggestive of a significant trend (p=0.08)
suggestive of statistical significance (p=0.06)
suggestively significant (p=0.064)
tailed to insignificance (p=0.1)
tantalisingly close to significance (p=0.104)
technically not significant (p=0.06)
teetering on the brink of significance (p=0.06)
tend to significant (p>0.1)
tended to approach significance (p=0.09)
tended to be significant (p=0.06)
tended toward significance (p=0.13)
tendency toward significance (p approaching 0.1)
tendency toward statistical significance (p=0.07)
tends to approach significance (p=0.12)
tentatively significant (p=0.107)
too far from significance (p=0.12)
trend bordering on statistical significance (p=0.066)
trend in a significant direction (p=0.09)
trend in the direction of significance (p=0.089)
trend significance level (p=0.06)
trend toward (p>0.07)
trending towards significance (p>0.15)
trending towards significant (p=0.099)
uncertain significance (p>0.07)
vaguely significant (p>0.2)
verged on being significant (p=0.11)
verging on significance (p=0.056)
verging on the statistically significant (p<0.1)
verging-on-significant (p=0.06)
very close to approaching significance (p=0.060)
very close to significant (p=0.11)
very close to the conventional level of significance (p=0.055)
very close to the cut-off for significance (p=0.07)
very close to the established statistical significance level of p=0.05 (p=0.065)
very close to the threshold of significance (p=0.07)
very closely approaches the conventional significance level (p=0.055)
very closely brushed the limit of statistical significance (p=0.051)
very narrowly missed significance (p<0.06)
very nearly significant (p=0.0656)
very slightly non-significant (p=0.10)
very slightly significant (p<0.1)
virtually significant (p=0.059)
weak significance (p>0.10)
weakened..significance (p=0.06)
weakly non-significant (p=0.07)
weakly significant (p=0.11)
weakly statistically significant (p=0.0557)
well-nigh significant (p=0.11)
One blogger even went so far as to implement the list in R so that when a significance level between .05-.12 is registered, it randomly selects one of those “p excuses” to describe the result.
Hankins’ advice is not to waffle: if your p value is below 0.05 (or presumably whatever you set your alpha level to), your result is significant. If it’s at or over that value, it’s not significant. No “marginal” in betweens or creative expressions such as “very closely brushed the limit of statistical significance (p=0.051).” By the way, does anyone not see a counterfactual thinking study here just waiting to be exploited? (Recall “The loser that almost won” by Kahneman and Varey 1990).
In a related blog post, Hankins shows this wonderful figure he generated from Google Scholar search results.
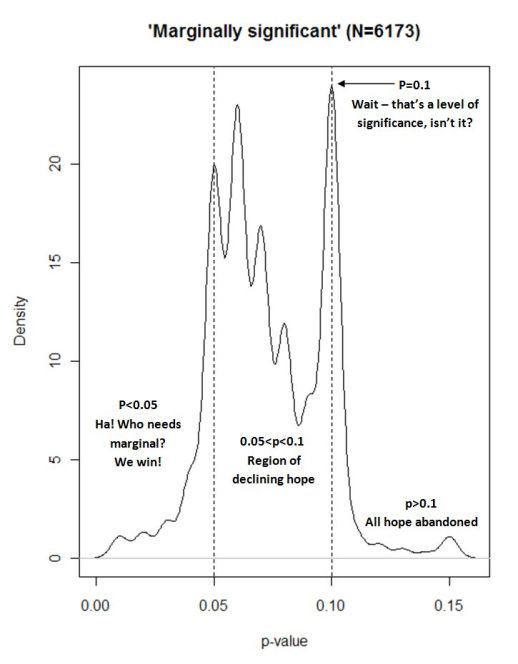
It certainly makes a point. We have a problem when p = 0.10 is described as marginally significant more frequently than values between 0.050 and 0.094.
And Hankins’ comments in the figure essentially capture the psychology of significance test reporting.
But something about the advice just doesn’t make sense to me. Hankins, like most of us, realizes that the 0.05 level is arbitrary. How could it be, then, that it makes sense to describe one’s results as significant when p is just below that arbitrary value — say 0.049 — while an ever so slightly different result — say 0.050 — ought to be instead labelled not significant.
Is this not the path to madness?
Perhaps the use of “marginally significant” is also partly an attempt by researchers to cope with the craziness of an arbitrary cutoff that defines whether they are to claim their results are “significant” or not.
Marginality at least allows a grey zone around the point of insanity to be defined. The problem is not the grey zone, but rather the use of the arbitrary cutoff.
As I noted in my reply to Neil, although more journal editors and reviewers are calling for effect sizes, most still expect some significance testing to accompany that.
Perhaps it would be wiser to stop calling the p values we standardly report “significance” values, and instead call them what they are: the probability of data given the null hypothesis is true.
Doing that would have two immediately beneficial effects. First, it would correctly define those values, which are often misinterpreted as 1 – the probability of the experimenter’s hypothesis being true, given the data. For instance, one commenter states “All a p-value of 0.05 means is there’s a 95% chance that the hypothesis was indeed working.” Second, it would get us away from the arbitrariness of p < 0.05.
In the end, the circumlocution researchers use in describing the results of their significance tests may not be excusable, but it is understandable not only as a tactical maneuver to keep studies out of the unpublished file drawer, but also as a means of coping with the senseless arbitrariness of a point that separates a continuum into two alternatives: significant or not.
