Aldous Huxley once wrote that “Consistency is contrary to nature, contrary to life. The only completely consistent people are the dead.”
That may be so, but among the living there is natural variation or, as psychologists like to say “individual differences”, in consistency across individuals.
In a recent paper, my colleagues, Chris Karvetski, Kenneth Olson, Charles Twardy, and I examined whether we could leverage that variation in consistency or logical coherence to improve the accuracy of probabilistic judgments aggregated across a pool of individuals.
Although judgment and decision-making researchers have long been interested in how coherent and how accurate people are in making judgments, relatively few studies have examined how accuracy and coherence are related to one another.
Coherence does not imply accuracy. To see why, imagine I had a fair coin and I asked you what the chances were that it would come up heads on a coin toss. Let’s say you said 30%. Now suppose I also asked you to give me your estimate of the chances that it will come up tails, and you said 70%. Given there are only (and, yes, let us assume there are only) two possibilities — heads or tails (and no coins landing standing up) — the chances assigned to those two outcomes must sum to 1.0. This is what’s known as the additivity property in probability calculus. And it is a logical necessity. While there are an infinite number of ways to divide the probability of something happening into the two mutually exclusive and exhaustive possibilities — namely, a probability of 1.0 that the coin will land on heads or on tails — it is a logical necessity that they add up to 1.0. To put it more succinctly, they must add to 1.
So, in the example, your estimates are coherent, at least in the sense that they are additive, but clearly they’re not accurate since, by definition, a balanced coin has an equal chance of landing on heads or tails. In other words, your estimate of landing on heads (30%) should have been raised by 20 percentage points, while your estimate of landing on tails (70%) should have correspondingly been lowered by 20 percentage points.
One can be coherent, but inaccurate. However, if one is incoherent, then one has to be inaccurate. But, in making this statement, we have to be careful not to imply that those who are incoherent are necessarily less accurate than those who are coherent. Imagine you had said that there was a 50% chance of landing on heads and a 70% chance of landing on tails. Clearly, these estimates are incoherent because they are not additive. They add up to more than the probability that something will happen — namely, 1.0.
A sidebar: Note that because that probability — P(something happening) = 1.0 — is less than the sum of the probabilities assigned to the heads and tails outcomes, we say that the estimates are subadditive (e.g., see Tversky & Koelher, 1994). I know…. It might have been less confusing to say that the probabilities are superadditive because they add up to more than 1.0, but as Einstein said “it’s all relative.” Now that we’re stuck with these semantic abominations, we better just use the terms consistently. And, by the way, yes, superadditivity refers to cases where the probabilities of heads and tails (in our example) sum to less than one. Go figure! But, as well, just get over it.
So, back to our example. Your estimates are incoherent because they don’t respect the additivity property. But, your estimates are also more accurate than in the first example. The simple way to think of this is that your first estimate is now bang on: P(heads) = 0.5. Meanwhile your second estimate is no worse off than in the first example. You’re still 20 percentage points over on tails.
Another way of comparing the relative accuracies in the two examples is to calculate the difference between the estimated probability of each outcome and its true probability, square the differences, and then take the arithmetic average (the mean) of those values. If we do that in the first case, where you’re coherent, the mean squared error is:
MSE = [(0.3 – 0.5)^2 + (0.7 – 0.5)^2]/2 = 0.04.
While in the second example where you were incoherent, the same measure yields:
MSE = [(0.5 – 0.5)^2 + (0.7 – 0.5)^2]/2 = 0.02.
Since MSE = 0 represents perfect accuracy on a ratio scale of measurement, we see that you were twice as inaccurate when coherent than when you were incoherent.
So, incoherence doesn’t imply greater inaccuracy, but it does imply some inaccuracy. That much is necessitated, and to see why think about what incoherence implies when at least one of your estimates is correct. If, as in the previous example, your estimate of the probability of a heads outcome is correct, then it would also be correct to say that the probability of the only other possible outcome would have to be 1 minus that probability, which would be 0.5 in our case. So, any form of nonadditivity implies that across all the estimates given, there has to be some inaccuracy. It might be that all estimates are inaccurate — that we don’t know, in principle — but we do know, in principle, that some estimates must be inaccurate if logically related estimates violate the constraints of logic.
I’ve gone through these points, in part, to clarify that the question my colleagues and I posed is one that requires empirical investigation. We cannot simply assume that people who are more coherent are more accurate.
Nevertheless, our hunch was precisely that. We expected that people who offered probability estimates for logically related sets of items that were relatively more coherent would also show relatively better accuracy on those same items.
Unlike the coin-toss examples, we used questions where there was a clearly correct answer that served as the benchmark of accuracy. For instance, an experimental subject might be asked to give the probability that “Hydrogen is the first element listed in the periodic table.” They would cycle through 60 such problems, in each case assigning a probability from 0 to 1, and then they would come back to a related one. This process would repeat itself four times until subjects completed all 240 questions. The related problems which appeared in these spaced sets of four all had the structure A, B, (A U B), and ~A (where U means “union” and ~ means “not”). As well, the problems were chosen so that A and B were mutually exclusive but not exhaustive — in other words, B was not equal to ~A, but always a subset of it.
Accordingly, a logically coherent subject would be required to give estimates that respect the following:
P(A) + P(~A) = 1.0.
P(A) + P(B) = P(A U B).
P(B) <= P(~A).
For instance, imagine:
A = Hydrogen is the first element listed in the periodic table.
B = Helium is the first element listed in the periodic table.
A U B = Helium or hydrogen is the first element listed in the periodic table.
~A = Hydrogen is not the first element listed in the periodic table.
So, since A is true, a perfectly coherent and accurate set of assessments would be:
P(A) = 1.0.
P(B) = 0.
P(A U B) = 1.0.
P(~A) = 0.
In our first experiment, which I’ll focus on here, the actual order of these elements was randomized. We spaced and randomized the related items to minimize the chances that subjects would realize their logical relationship to each other, which might in turn reduce variability in incoherence across subjects.
The first thing we wanted to test was whether simply transforming subjects’ judgments so that they were made to be as close to a coherent set as possible would improve accuracy. It did. Using the same MSE measure we used earlier (called a Brier score, when the true values are represented by 1 for True and 0 for False), we found about an 18% improvement in accuracy simply by forcing the estimates into a coherent approximation. The paper goes into detail on how that’s done, but for our purposes here, consider the simple coin-toss example, where you said P(heads) = 0.70 and likewise for tails. That’s subadditive since the two probabilities add up to 1.40 rather than 1.0. We could simply adjust them, however, so that they maintain the same proportion of the total probability, but change the total so that it’s 1.0. In this case, each of our estimates changes to 0.50. We found that doing this — what we and others call coherentizing the estimates — helped to improve accuracy.
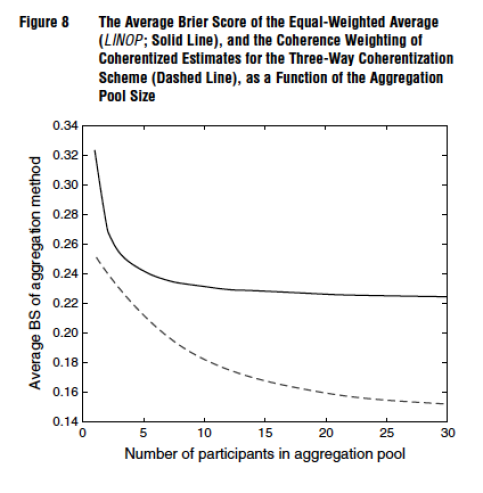
But, we also wanted to test whether the global accuracy of the entire subject sample could further be improved by weighting each subject’s contribution to a pooled estimate for a given item, A, by the degree of incoherence the subject expressed for the set of four items. That is, the less coherent one is for a given set of related items, the less they would contribute to the pooled estimate for that set. The paper describes many different instantiations of that approach, but the bottom line is that the most effective of the approaches we tested led to yet another substantial increase in accuracy for pooled judgments above and beyond that yielded by coherentization alone. There was over a 30% increase in accuracy by first coherentizing judgments and then coherence weighting subjects’ contributions to a pooled accuracy estimate.
Figure 8 from our paper, for instance, compares the average Brier score (BS) for an unweighted linear average of subjects to a coherence weighted pool for different pool sizes. As can be seen, the benefit of aggregation levels off rather quickly for the unweighted average but continues to show improvements as a function of pool size increases over a much greater range.
When the accuracy improvement was broken down further, it translated into improvements to both calibration and discrimination. Calibration is a measure of reliability. A reliable probabilistic forecaster or judge will assign subjective probabilities that over time correspond with observed relative frequencies. So, if in 100 cases where a forecaster says he’s 80% sure the event will happen, the forecaster would be perfectly calibrated if 80 of those events occurred and 20 did not. Same would go for all the other probabilities assigned between 0 (impossibility) and 1 (necessity).
Discrimination, on the other hand, has to to with how well the forecaster or judge separates events into their correct epistemic or ontological categories. In our experiment, that involved separating statements that were true from those that were false. In a forecasting task, it might involve separating events that eventually occur from those that don’t.
One could have perfect calibration and the worse possible discrimination if one simply forecasted the base rate of an event category. For instance, in the balanced coin example, simply assigning a probability of 0.50 to each outcome ensures perfect calibration and no discrimination. In principle, one could also have perfect calibration and perfect discrimination if one were to behave like a clairvoyant — namely, by always correctly predicting outcomes with complete certainty. In principle, one could also discriminate perfectly and be completely uncalibrated. If, for instance, I forecasted like a clairvoyant except that every time I predicted occurrences with certainty the events didn’t occur and every time I predicted non-occurrences with certainty the events did occur, then I’d still have perfect discrimination because I did separate occurrences from non-occurrences. However, it’s clear that I’ve mislabeled my predictions. Such behavior is sometimes called perverse discrimination since it is odd to mix perfect discrimination with backward labelling. And sometimes it’s called diabolical discrimination (under the assumption that the forecaster or judge is trying to mislead an advisee).
Our approach benefitted both calibration and discrimination. This is important because many optimization procedures (e.g., extremizing tranformations; see, e.g., Baron et al., 2014) tinker with calibration, but leave discrimination unchanged. Yet, arguably, what matters most in many contexts involving probabilistic judgment is good discrimination — separating truth from falsity, occurrence from non-occurrence, etc.
So, we can indeed leverage the natural variation in forecasters’ logical coherence by eliciting sets of related judgments from them and then using the expressed incoherence to optimize their forecasts and optimize their forecasts’ contribution to a pool of weighted forecasts.
Oscar Wilde once said that “Consistency is the hallmark of the unimaginative.” Maybe so, but as we have learned, consistency — at least logical consistency — is also a hallmark of the accurate. That may be less quotable, but in practice it can be quite useful to know.
Credits: the opening image was found here. Apparently, it’s from punk zine called Incoherent House and was the front cover of the forth issue. Things you learn while searching for the odd image.